Population reports for any point in Africa
How many people live within 5 km of your site? Get a figure you can defend.
Send a location and the distances you need. You receive a short PDF and an Excel file with a best estimate, the range across two independent population models, and an age and sex breakdown.
Built for environmental and social impact assessments, health and school catchments, and site selection. Every figure is sourced and every method step is written down.
Why a single number is not enough
Free radius tools return one figure from one dataset. In African cities the leading population models often disagree by 50% or more, especially on fast-growing urban edges. A reviewer who checks your figure against another source will find the gap. Our reports show it first and explain it.
| What you get | Typical free radius tool | SpatialBasis report |
|---|---|---|
| Population in a true-distance circle | Yes | Yes |
| Second independent model and a range | No | Yes |
| Reliability flag for each ring | No | Yes |
| Partial grid cells counted by area (accurate for small rings) | Rarely | Yes |
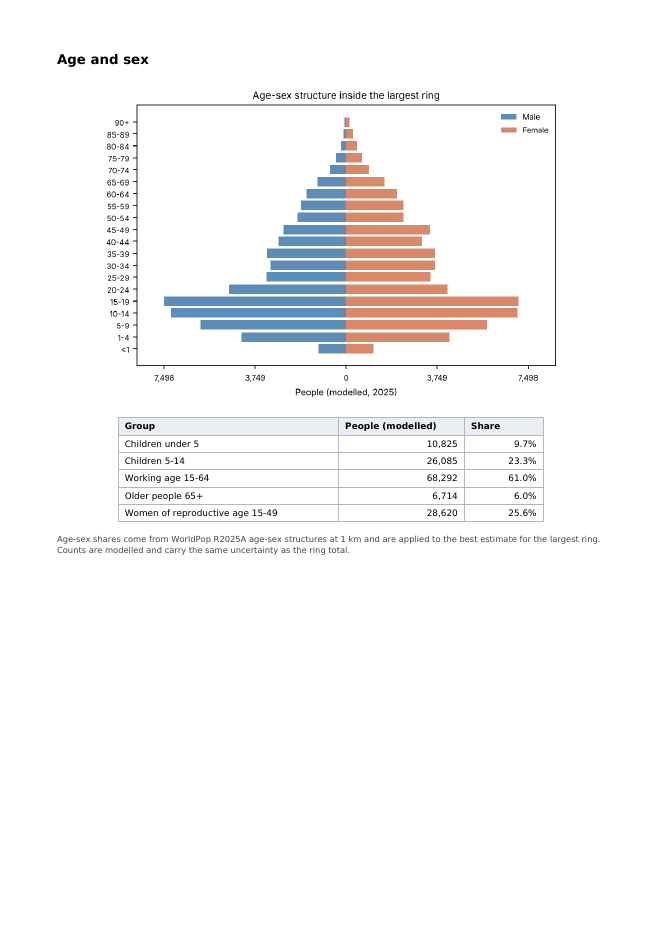
| Age and sex structure | No | Yes |
| Official census benchmark nearby | No | Where published |
| Citable sources and method note, Excel data | No | Yes |
Sample reports
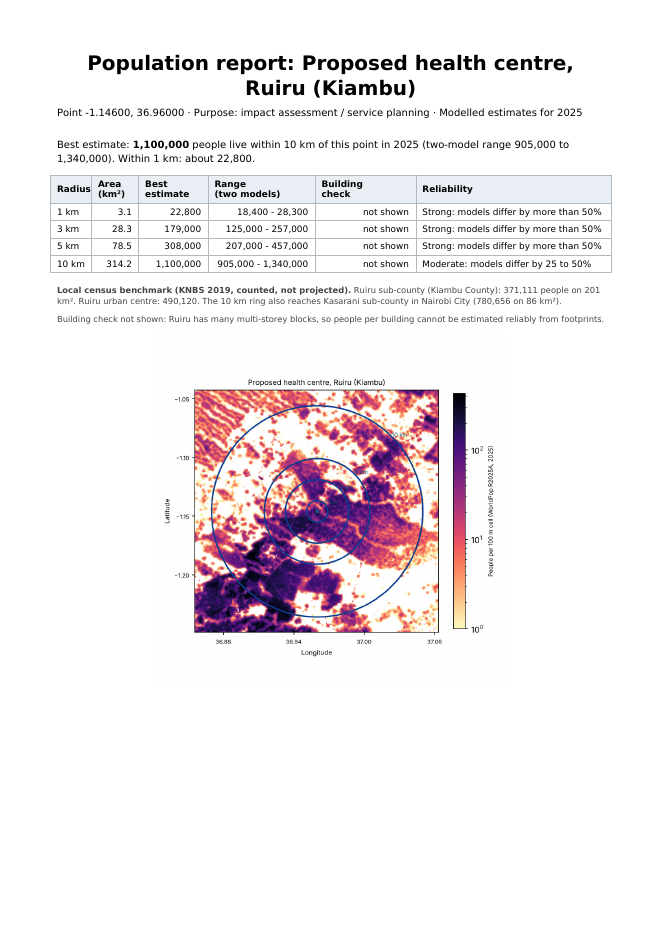
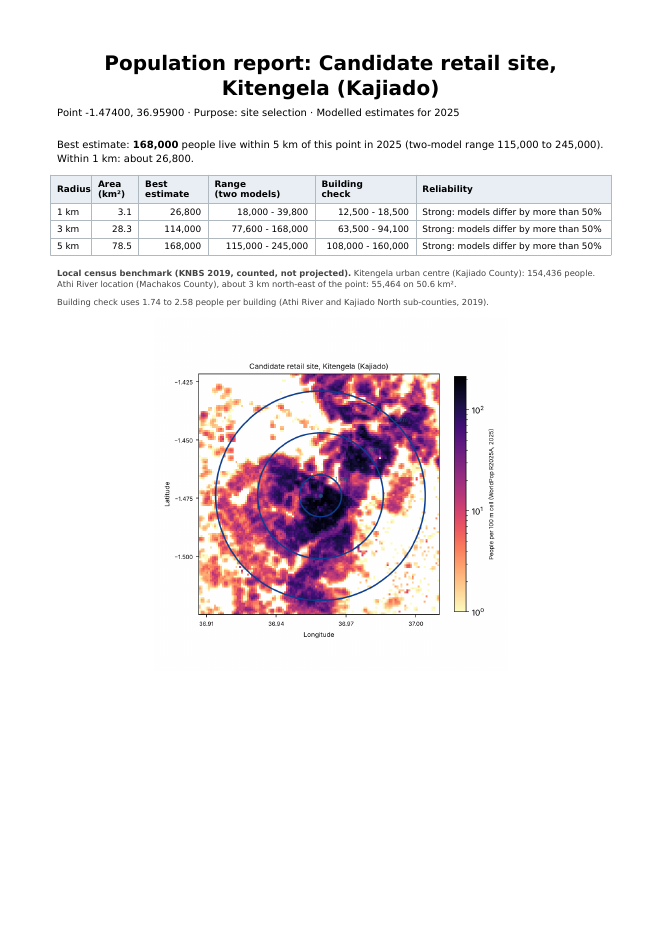
Three real sites in Kenya, run with the same method and the same rule for the best estimate.
Pricing
Introductory prices. Delivery within two working days by email.
- One point, up to four distances
- Best estimate, two-model range and reliability flags
- Local census benchmark where published
- PDF report and Excel data
- Everything in Core
- Custom boundary (project footprint, catchment, corridor)
- Age and sex structure and key groups
- Building-footprint check where it is reliable
- Method note ready to paste into your report, one revision
Method in brief
Data
WorldPop Global2 R2025A (100 m, constrained) and GHS-POP R2023A (100 m, European Commission JRC), both open under CC BY 4.0. Age and sex from WorldPop R2025A. Building footprints from Google Open Buildings v3.
Rings
Circles use true ground distance. Each grid cell counts in proportion to the share of its area inside the circle, so small rings are not distorted by whole-cell rounding.
Best estimate
If the two models are within 25% of each other, we report WorldPop. If they differ more, we report the geometric midpoint. The rule is fixed in advance and the same for every client.
Limits
All figures are modelled estimates, not census counts. Census benchmarks use official boundaries that differ from your rings. We say so in every report.
Request a report
Fill in the form. It writes your request; copy it and send it by email. You will get a quote confirmation and a payment link before any work starts.
spatialbasis@gmail.comCoordinates in decimal degrees (for example -1.47400, 36.95900). For a custom area, attach a KML, GeoJSON or shapefile to your email.